Thursday, March 28, 2019

Implementing SMED


Implementing SMED

In my last blog ( "SMED Explanation " - Link : 
https://kalpanathchatterjee.blogspot.com/2019/03/smed-explanation.html), I have already detailed that Japanese Industrial Engineer Shigeo Shingo gave birth to the concept of SMED by helping companies dramatically reduce their setup change over time. With his concepts he was  able to bring down the changeover times averaging 94% as documented.

It may be hard to imagine that the change over time have improvement by a factor of approximately 20. E.g - setup time of 90 minutes have been brought down to 5 minutes across the wide range of companies.


Let us take an example of tire changing in a car. For an expert technician changing a tire can take 15 minutes. On the other hand a NASCAR pit crew, for changing 4 tires takes less than 15 seconds they use the concepts of SMED. To understand this we need to know how SMED is implemented. While conducting SMED project program the activities of changeover process termed as work elements needs to be studied thoroughly. 


There are two types of work element category, i.e. Internal Element and External Element. 
  • Internal Element: Work elements that can be performed only when the machine / equipment is completely stopped.
  • External Element: Work elements that can be performed even if the machine / equipment is running.
An Industrial Engineer must not assume, or must not take decision based upon one single Setup change trial. If possible video graphing of the setup/ changeover may be done during dry-run of the changing over process for at least five setup/ change overs. Time recording must be done for each of the work elements. Outlier conditions must be critically observed. Focused problem solving along with team brain storming must be the approach along with no-cost or low cost automation.Clear separation of Internal and external work elements must be done. Following figure explains the external and internal element separation exercise:


  • How to Select an SMED Project Pilot Area?
It has been detailed in my earlier blog (link: https://kalpanathchatterjee.blogspot.com/2019/03/smed-explanation.html)
that SMED targets that the changeover process must get completed in less than 10 minutes ( Single Digit Minute). It is always better to go for SMED implementation at Pilot Machine at the initial phase of understanding building. In order to have better results project team must include complete spectrum of employees associated with machine/ equipment. The pilot area for SMED program depends on selection of ideal equipment having following characteristics:

S. No.
Characteristics
Description of relevance
1.
Duration of Changeover
The changeover should be long enough to have significant room for improvement. E.g. Approximately one hour implementation time may be able to present a good amount of room for SMED implementation.
2.
Variation in changeover time
If there is presence of large variations in changeover time, (i.e. Changeover time variation ranges from one to three hours), than the machine should be selected to run pilot project.
3.
Opportunities for testing
If the frequency of changeover is high (approximately thrice in a week) then the implemented improvements done in SMED project can be easily tested.
4.
Familiarity with the machine/ equipment
The project team must be familiar with the machine / equipment selected to run pilot project.  
5.
Constraint analysis
If the equipment is a bottleneck in the process then improvement project must be conducted on it. Changeover time reduction will help in line balancing as well.

Once the equipment is selected, to begin with, the project execution team must follow the conventional way of conducting SMED Implementation. Figure below describes the complete set of processes: 

The detailed Seven stages of SMED is described in the following links:
1.       Document the setup/changeover and separate the work elements in to internal and external Elements  (Link : Step 1 of SMED Implementation)
2.       Standardize external setup activities (Link : Step 2 of SMED Implementation)
3.       Convert internal setup activities to external setup activities (Link: Step 3 of SMED Implementation)
4.       Improve internal changeover tasks ( Link : Step 4 of SMED Implementation )
5.       Improve external setup tasks (Link: Step 5 of SMED Implementation)
6.       Mechanizing the setup or using automation (Link : Step-6 of SMED Implementation)
7.       Complete elimination of changeover -Ideal Situation (Link: Stepn7 of SMED Implementation)


To be continued…

Monday, March 25, 2019

SMED Explanation

SMED


Shigeo Shingo
SMED is an acronym for Single Minute Exchange of Die. Now a days, this is a widely used phrase, common across all manufacturing industries. "Single Minute" does not imply that the changeovers need to happen in just 1 minute, but that it should be completed in less than 10 minutes (Single digit minute). SMED concept basically advocates rapid set-up changeovers. It is one of the many lean manufacturing methods, reducing waste in manufacturing process. 
History and background: 
The origins of SMED can be traced back in the past 1950s in Japan. The concept initially was demonstrated by Shingeo Shingo during the inception days of Toyota Production system, to reduce the setup time of the molding process associated to car body.
Henri Foard


Similar lean practices were also observed at Ford Motor Company in earlier 1920s to reduce the manufacturing cost of Model T vehicle. One of the great example being, the multiple drills for the engine block, which included dozens of drill bits of different sizes. At Ford Motor Company, they improved the process of multiple pass to single pass operation for all required holes at specific orientation.
Alfred P. Sloan


In the year 1930, General Motor Works Company, along with Alfred P. Sloan brought the concepts of rapid Change Overs in order to be able to bring New Models every year. At that time only General Motors managed to bring down their model changeover time to be around 20 days compared to 6 months of Ford Motor Company.


However, many researchers from United States of America were also working on different aspects of lean and drastic reduction of Changeover time. Probably the most prominent names in this era were motion expert Frank Gilbreth and the father of scientific management, Winslow Taylor. Gilbreth studied and improved working processes in many different industries, from bricklaying to surgery. As part of his work, he also looked into changeovers. His book Motion Study (also from 1911) described approaches to reduce setup time. He gave birth to the concept of THERBLIG, which are 18 kinds of elemental motions used in the study of motion economy in the workplace. Taylor analyzed non-value-adding parts of setups in his book, Shop Management, written in 1911 and his studies were widely excepted and removal NVA ( Non Value Added) activities were well taken in lean practices.

Fig 1. A Brief History – a schematic diagram depicting the maturation of lean practices


Concept Explanation:
During Setups, there are activities that can be performed while the process is still running. These activities are termed as External Activities. At the same time during setups there are some activities which can only be performed when the process is completely stopped. These activities are termed as Internal Activities. SMED focuses on making the work elements external as many as possible and then simplifying and stream lining all other work elements.
Before understanding the concept of SMED we need to understand what is change over and thereby we need to understand change over time.
·         Changeover Time: In most of the manufacturing factories where same set of machines are used to produce products or components of different specifications, they face issues of down time due to machine stoppage during changeovers. These are the stoppages, consciously taken for preparing the machine to swap from one component to another component. These setup changeovers are non-value added activities, as explained in the following Diagram.


Fig2.: Explanation of Changeover time and Non Value added activity

  • ·         Elements of changeover :

Now as we have understood the concept of Setup or changeover, we need to understand and measure the elements of Setup. Measurement of work elements in terms of time is very important, because we can’t improve something that we can’t measure. Anyway, below is a tentative structure of elements of setup converted into a pie chart of percentage contribution of each type of work element. 


                                                   Fig 3. Explanation of Elements of Changeover 

  • ·         Benefits of SMED :As we have understood the concept of SMED and thereby, have known some of the aspects of changeover, so before getting into the steps of implementing SMED, I would like to give a critical overview of the benefits of SMED implementation.
#
Target Matrices
Means or Measures
Benefits in the form of Out Comes
1
Increased Capacity
Reduced changeover time
Production capacity enhancement
2
Reduced manufacturing cost
Faster changeover means less equipment down time
Increased machine availability
3
Smaller lot sizes
More frequent product changeovers
More product portfolios can be addressed through same manufacturing setup
4
Improved responsiveness towards customer expectations
More flexibility is available for scheduling
More variants can be adjusted to  fulfill customers’ expectations in the same production line
5
Lower inventory levels
Demand of smaller lot size in the production process with increased variants
Lower inventory levels due to smaller lot sizes which makes it more easy to manage
6
Smoothening Startup
Standardized changeover process is built
Improved consistency and quality due to focused improvements

·         SMED Implementation Process :
The typical SMED implementation plan covers the following 7 steps as detailed below; and most often the lion’s share of all gains are made from the following first 5 steps :
1.       Separate the internal from external setup activities
2.       Standardize external setup activities
3.       Convert internal setup activities to external setup activities
4.       Improve internal changeover tasks
5.       Improve external setup tasks
6.       Mechanizing the setup or using automation
7.       Complete elimination of changeover ( Ideal Situation)

In my next blog I will explain the 7 steps with illustrative examples. Thanks for reading…! Hope this will help and add value.

Tuesday, March 19, 2019

OEE Calculation

Overall Equipment Effectiveness (OEE) Calculation

OEE is an abbreviation used in most of the manufacturing industries around the Globe, for a special metric called Overall Equipment Effectiveness that takes in to account the three major indices which are as follows:
1. Availability
2. Performance
3. Quality
And their relationship is well described in the following equation:

Overall Equipment Effectiveness (OEE) = Availability Rating X Performance Rating X Quality Rating

Now ,
Available time = Plan Time = Time per shift x Number of  Shifts
Standard Allowance = Lunch Time + Tea Time  + Meeting Time…… etc.
Loading Time (Plant Running Time for actual) = Available time – Standard Allowance
Down Time =  (Break Down Time + Setup and Adjustment Time + Die and Tool Change Time + Startup Losses + Management Losses……… etc.)

Availability Rating 
Availability rating can be improved with bringing down the line stoppages and break downs . Availability takes into account Availability Loss, which includes all events that stop planned production for an appreciable length of time (typically several minutes or longer). Examples include Unplanned Stops (such as breakdowns and other down events) and Planned Stops (such as changeovers).
                            =[{ (Net Available time)/ Loading Time} X 100 ] %
                           =[{(loading Time – Down Time)/ Loading Time} X 100]%

Performance Rating
Performance Rating Can be improved eliminating no small stops or slow running. Performance takes into account Performance Loss, which includes all factors that cause production to operate at less than the maximum possible speed when running. Examples include both Slow Cycles, and Small Stops.
                            = [(Actual Produced Volume / Total Opportunity for
                                  Production) X 100 ] %
                             = [{Actual Produced Volume /
                                   (Net Available Time/ Standard Cycle Time )} X100] %
                             = [{(Actual Produced Volume X Standard Cycle Time ) /
                                  (Net Available Time)} X 100 ] %

Note :  Net Available time  = Loading Time – Down Time

Quality Rating
Quality Rating can be improved by allowing no defects to get created in the production process. Quality takes into account Quality Loss, which factors out manufactured pieces that do not meet quality standards, including pieces that require rework. Examples include Production Rejects and Reduced Yield on startup.
                              = [{Actual Produced Volume – ( Defect + Rework )} /
                                     Actual Produced Volume] X 100 %

Hence  ,
Overall Equipment Effectiveness (OEE)
OEE takes into account all losses i.e. Availability Loss, Performance Loss, and Quality Loss resulting in calculating the measure of truly productive manufacturing time.
                                         = Availability Rating X Performance Rating X
                                                                      Quality Rating

Now let us take an example on this ,

Example : Question -Calculate OEE of XYZ Plant as per the following Details Given Below :  
1. Number of Shifts ( the company operates in) : 3;
2. Working time per shift : 8 Hours;
3. Break time for food : 0.5 Hours  for  each shift ( ½ an Hour per shift);
4. Break time for tea : 15 Minutes ( two times for each shift);
5. Meeting Time : 15 Minutes for each shift;
6. Break Down time (A) : 2 Hours;
7. Setup Adjustments (B): 2.5 Hours;
8. Die and Tool Change time ( C) : 0.5 Hours;
9. Setup Losses (D) : 0.25 Hours;
10. Management Losses (E) : 3.75 Hours;
11. Production Volume : 750 Numbers of Components;
12. Defects produced on one Monday : 50 Number of components;
13. Total Rework done on components on  Monday : 100 Number:
14. Standard Cycle time per component : 50 seconds

Solution –
We Know ,
Original Equipment Effectiveness (OEE) = Availability Rating X Performance Rating X Quality Rating
 Now ,
Available time = Plan Time = Time per shift x Number of  Shifts
                                                              = (8 X3) Hours = 24 Hours  ;
Standard Allowance = Lunch Time + Tea Time  + Meeting Time
                                     = {(0.5X3)+ (0.25X2X3) + (0.25 X3)} Hours
                                     = 3.75 Hours ;
Loading Time ( Plant Running Time for actual)
                                    = Available time – Standard Allowance
                                    = (24-3.75) Hours = 20.25 Hours;
Down Time =  (Break Down Time + Setup and Adjustment Time +
                                +Die and Tool Change Time + Startup Losses
                                 + Management Losses)
                          =  (2+2.5+0.5+0.25+3.75) Hours = 09 Hours;
Availability Rating
                           =[{ (Net Available time)/ Loading Time} X 100 ] %
                           =[{(loading Time – Down Time)/ Loading Time} x 100]%
                           = [{(20.25-9)/20.25} X100]%
                           = 55.55 %
Performance Rating
                            = [(Actual Produced Volume / Total Opportunity for
                                  Production) X 100 ] %
                             = [{Actual Produced Volume /
                                   (Net Available Time/ Standard Cycle Time )} X100] %
                             = [{(Actual Produced Volume X Standard Cycle Time ) /
                                  (Net Available Time)} X 100 ] %
                              = [{ ( 750 X 50) /  (11.25 X 60 X 60 ) } x 100 ] %
                              =  92.22 %
Note :  Net Available time  = Loading Time – Down Time
                                                 = (20.25 – 9) Hours  = 11.25 Hours;
Quality Rating
                              = [{Actual Produced Volume – ( Defect + Rework )} /
                                     Actual Produced Volume] X 100 %
                              = [{ 750- (50+100)} / 750] X 100  %
                              = 80 %
 Hence  ,
Original Equipment Effectiveness  (OEE)
                                         = Availability Rating X Performance Rating X
                                                                      Quality Rating
                                         =  [( 0.5555 X 0.9222 X 0.8) X 100 ] %
                                         = 40.98 %

Happy Learning!... Plz give feedback on the Comment section.


Sunday, March 17, 2019

16 Major Losses in TPM


16  MAJOR  LOSSES

The 16 major losses that are identified and worked upon while implementing Total Productive Maintenance in a manufacturing plant are as detailed below : 


Category A.   Seven major losses that impede overall equipment efficiency: 

(1) Failure losses (Breakdown) : Losses due to failures/ break downs . Types of failures include sporadic function-stopping failures(complete break-downs), and function-reduction failures in which the function of the equipment drops below normal levels (partial break downs or slowing down of machine).
(2) Set up and adjustment losses: Stoppage losses that accompany set-up changeovers.
(3) Cutting blade change losses  : Stoppage losses caused by changing the cutting blade due to breakage, or caused by changing the cutting blade when the service life of the grinding stone, cutter or bite has been reached.
(4) Start-up losses : When starting production, the losses that arise until equipment start-up, running-in and production processing conditions stabilize.
(5) Minor stoppage and idling losses : Losses that occur when the equipment temporarily stops or idles due to sensor actuation or jamming of the work. The equipment will operate normally through simple measures (removal of the work and resetting).
(6) Speed losses : Losses due to actual operating speed falling below the designed speed of the equipment.
(7) Defect & rework loss : Losses due to defects & reworking  

CATEGORY B.   Losses that impede equipment loading time
(8) Shutdown (SD) losses : Losses that arise from planned equipment stoppages at the production planning level in order to perform periodic inspection and statutory inspection
CATEGORY    C.   Five   Major   losses   that    i mpede   workers   efficiency
(9) Management losses : Waiting losses that are caused by management, such as waiting for materials, waiting for a dolly, waiting for tools, waiting for instructions etc.
(10) Motion losses : Man-hour losses arising from differences in skills involved in etc.
(11) Line organization losses : Idle time losses when waiting for multiple processes or multiple platforms.
(12) Distribution losses : Distribution man-hour losses due to transport of materials, products (processed products) and dollies
(13) Measurement and adjustment losses : Work losses from frequent measurement and adjustment in order to prevent the occurrence and outflow of quality defects

CATEGORY D.  Three major losses that impede efficient use of production subsidiary resources
(14) Energy losses : Losses due to ineffective utilization of input energy (electric, gas, fuel oil, etc.) in processing. 
(15) Die, jig and tool losses : Financial losses (expenses incurred in production, regarding renitriding, etc.) which occur with production or repairs of dies, jigs and tolls due to aging byond services life or breakage.
(16) Yield losses : Material losses due to differences in the weight of the input

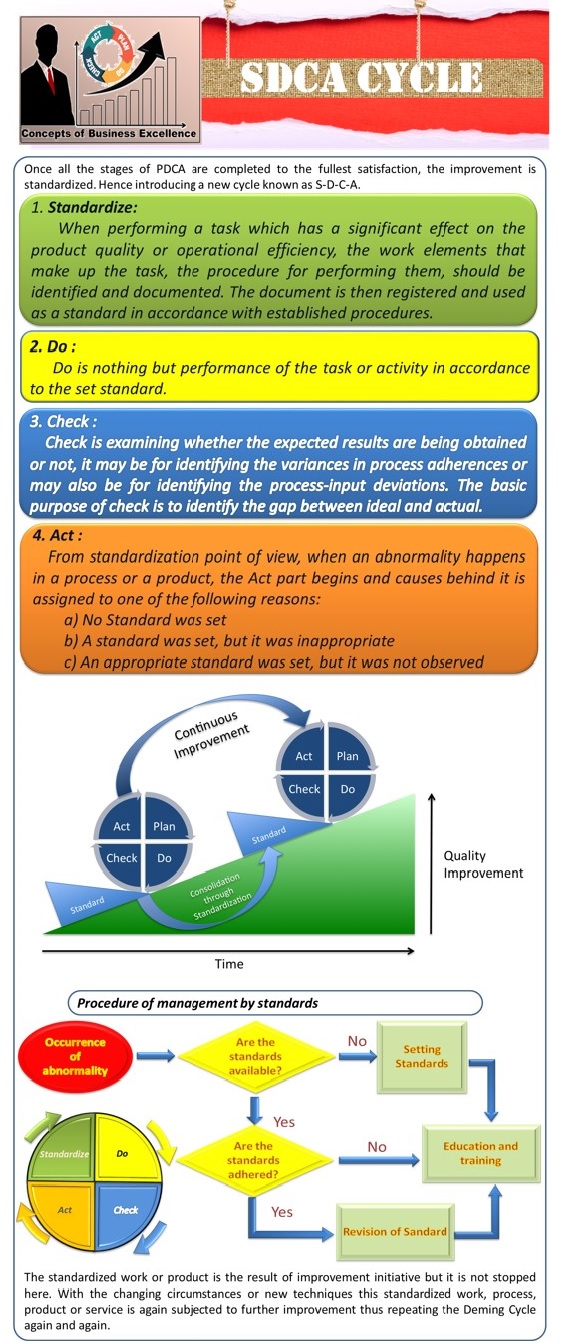
S-D-C-A Cycle

In Continuation of my previous blog on PDCA Cycle : https://kalpanathchatterjee.blogspot.com/2019/03/blog-post.html


P-D-C-A Concept

Hello and welcome to my blog on PDCA Cycle Concept.